
Extracting data from PowerPoint tables into Excel with VBA (and a little help from ChatGPT).
Extracting PowerPoint Table Data into Excel
There’s a wealth of data in your PowerPoint presentations. If only you could extract it quickly & easily.
If you work in a PowerPoint heavy industry such as consulting, financial services or private equity chances are you have hundred or even thousands of PowerPoint decks strewn across your network hiding a treasure-trove of data.
The big question is, how can you extract that data quickly and efficiently into Excel for analysis or repurposing?
We encountered this situation recently in a project for a large bank.
The PowerPoint Tables
The data, which needed to be consolidated for a dashboard, was in a PowerPoint file spread across 37 slides each with 11 tables. While the data originated from a series of CSV files, staff manually edited, manipulated and enriched the data in PowerPoint. It was the single version of the truth and the only complete data source we had to work with.
That’s 407 separate tables from which to extract data.
But there was a twist (isn't there always).
That’s 407 separate tables from which to extract data.
But there was a twist (isn't there always).
The catch was, none of the tables had a heading row which identified the table’s contents.
Instead, above each table, was a separate rectangle shape which contained each tables heading.
The question then became how to automate the process or associating each table with the nearest heading shape to know what data each table contained and pull all the data into Excel in the correct sequence.

Extracting the Table Data
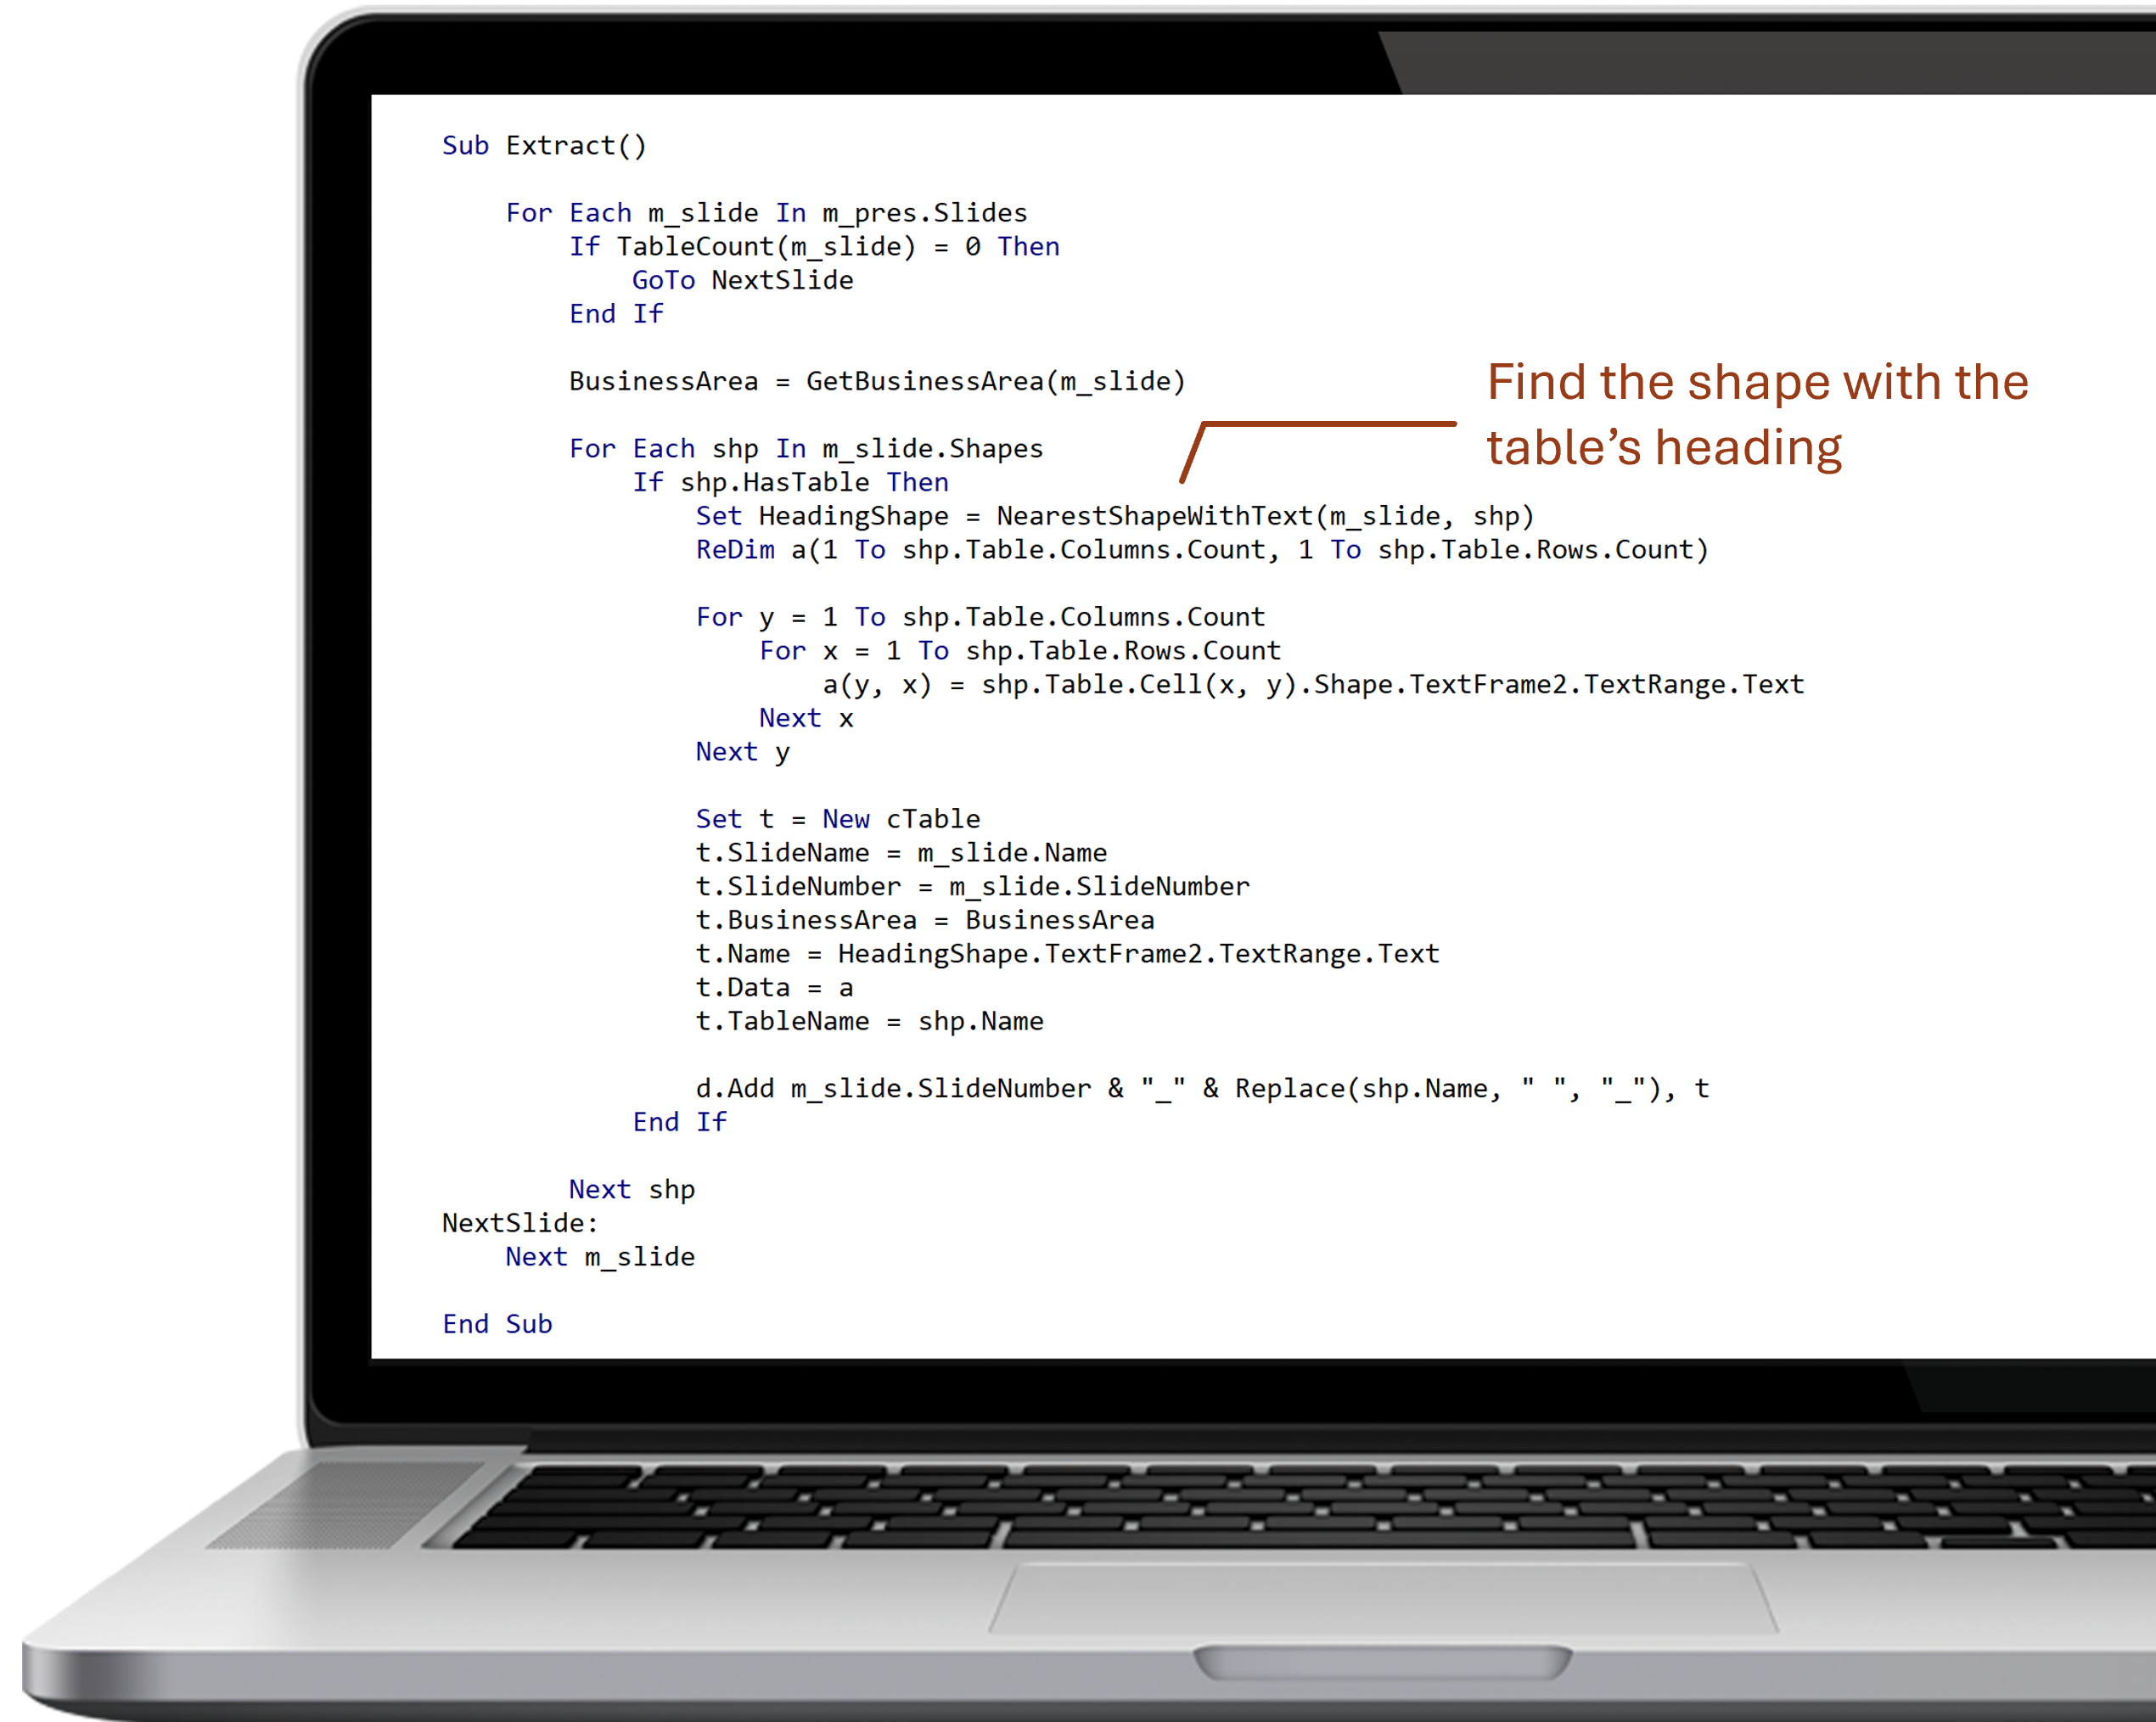
Extracting the data from the PowerPoint tables was simple enough with VBA. You can see the sample code in the carousel.
In PowerPoint, charts and tables are contained inside shapes (rectangles). The first step is to iterate through every shape in every slide and determine if it contains a table. If it does, extract the table data and squirrel it away.
Note, the function called NearestShapeWithText. This finds the shape which contains the corresponding table’s heading
Note, the function called NearestShapeWithText. This finds the shape which contains the corresponding table’s heading
Find Each Table's Heading
Rather than dusting off the old geometry books, I asked ChatGPT to find the heading shape closest to a given table.
I asked ChatGPT:
I asked ChatGPT:
Free Download
Unlock Proven Excel Solutions for Financial Services Efficiency
Discover how Excel automation can drive measurable results. This exclusive portfolio showcases over 30 high-impact projects, each designed to streamline workflows, save time, and reduce operational risks for financial services firms. Download now to see real examples of how we’ve helped firms like yours achieve ROI gains of up to 631%.

The final VBA code took three iterations to fine tune. You can see the code it finally suggested in the below although it's cleaned it up a little.

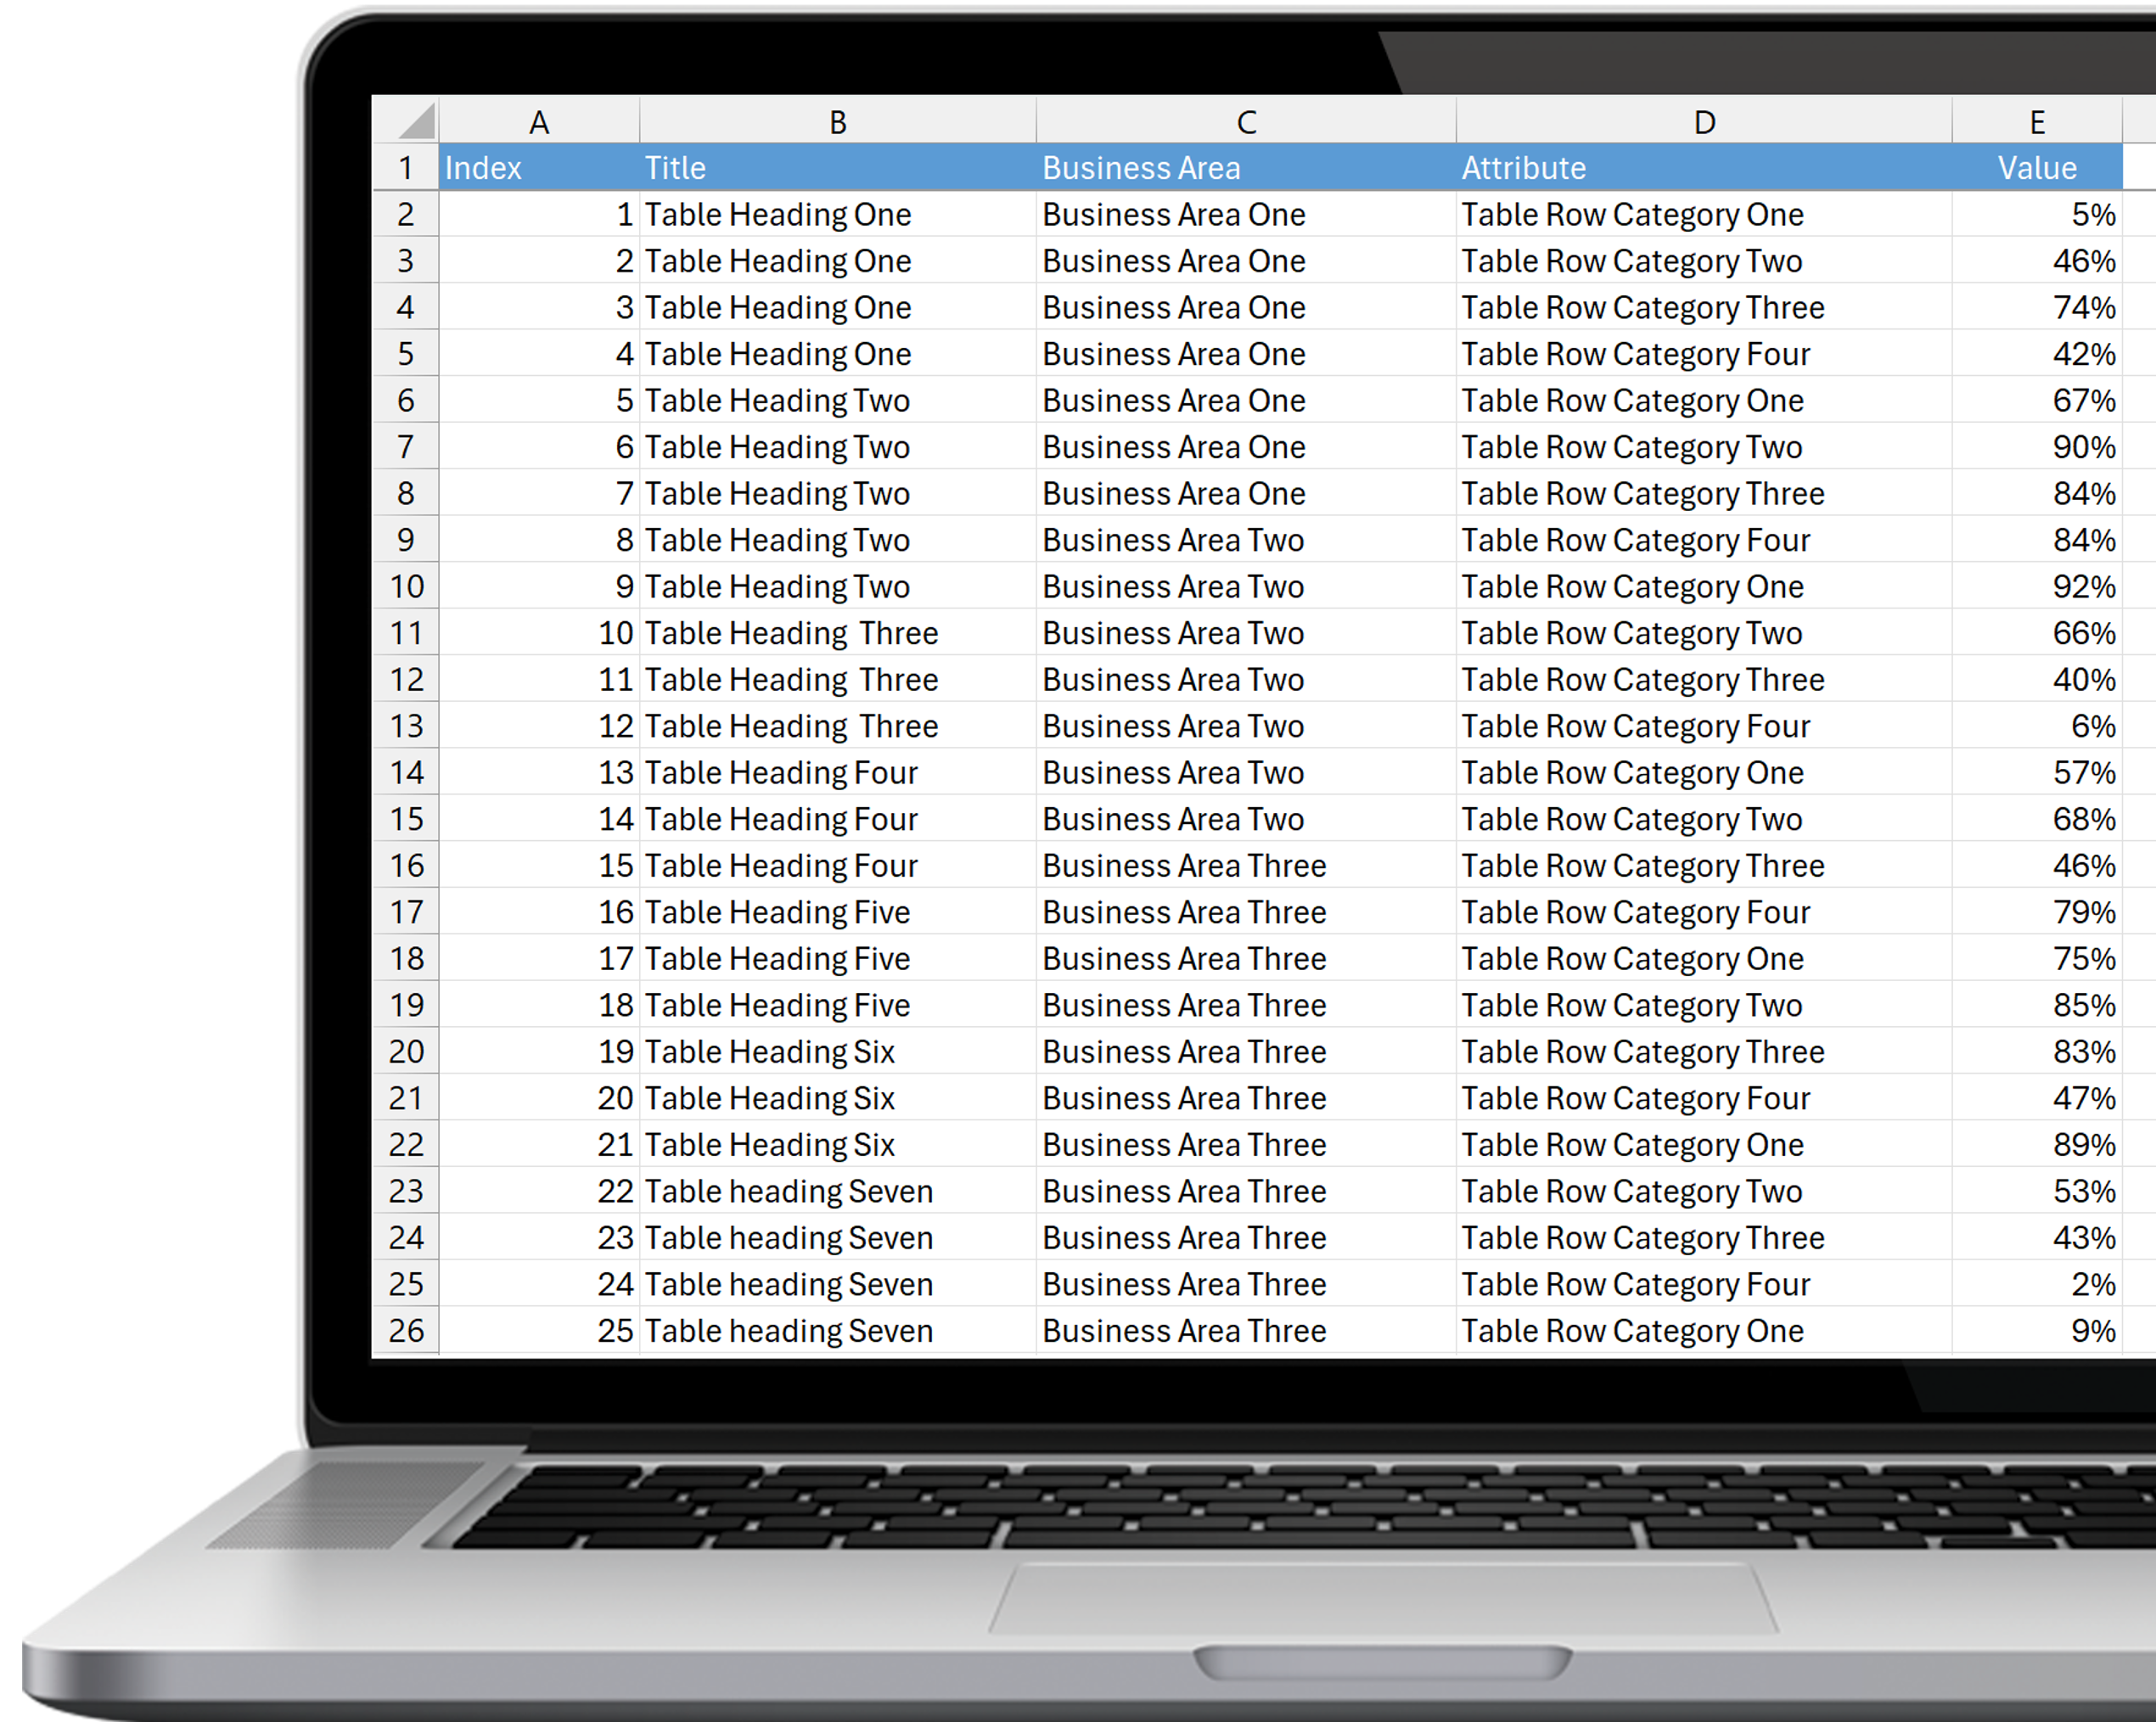
The Extracted Data
The result was an Excel table of data extracted from 407 individual PowerPoint tables which could now be queried and analysed quickly and easily.
A repeatable, error-free (and tedium free) process which took seconds rather than hours.
A repeatable, error-free (and tedium free) process which took seconds rather than hours.
Ready to Transform your Excel Experience?
If you’re looking to take Excel from “tedious” to “transformative,” let’s talk about how we can make Excel work for you, not against you.
Reach out to discuss your needs, and together, we’ll explore solutions that make your work easier and more impactful.
The Data Buried in your PowerPoint Charts
You may have a wealth of data buried in PowerPoint Charts instead (or as well).
The same approach described here can also be applied to extract data from Charts in PowerPoint slides and bring that data into Excel for analysis or repurposing.
And like the approach for PowerPoint Tables, extracting data from hundreds or charts in hundreds of PowerPoint presentations can be automated to run in minutes, not hours (or days) were you to do it manually.
0 comments