Index Correlations Report
Automated Correlation Reporting for Multi-Index Analysis
Client
Investment Bank
Business Problem
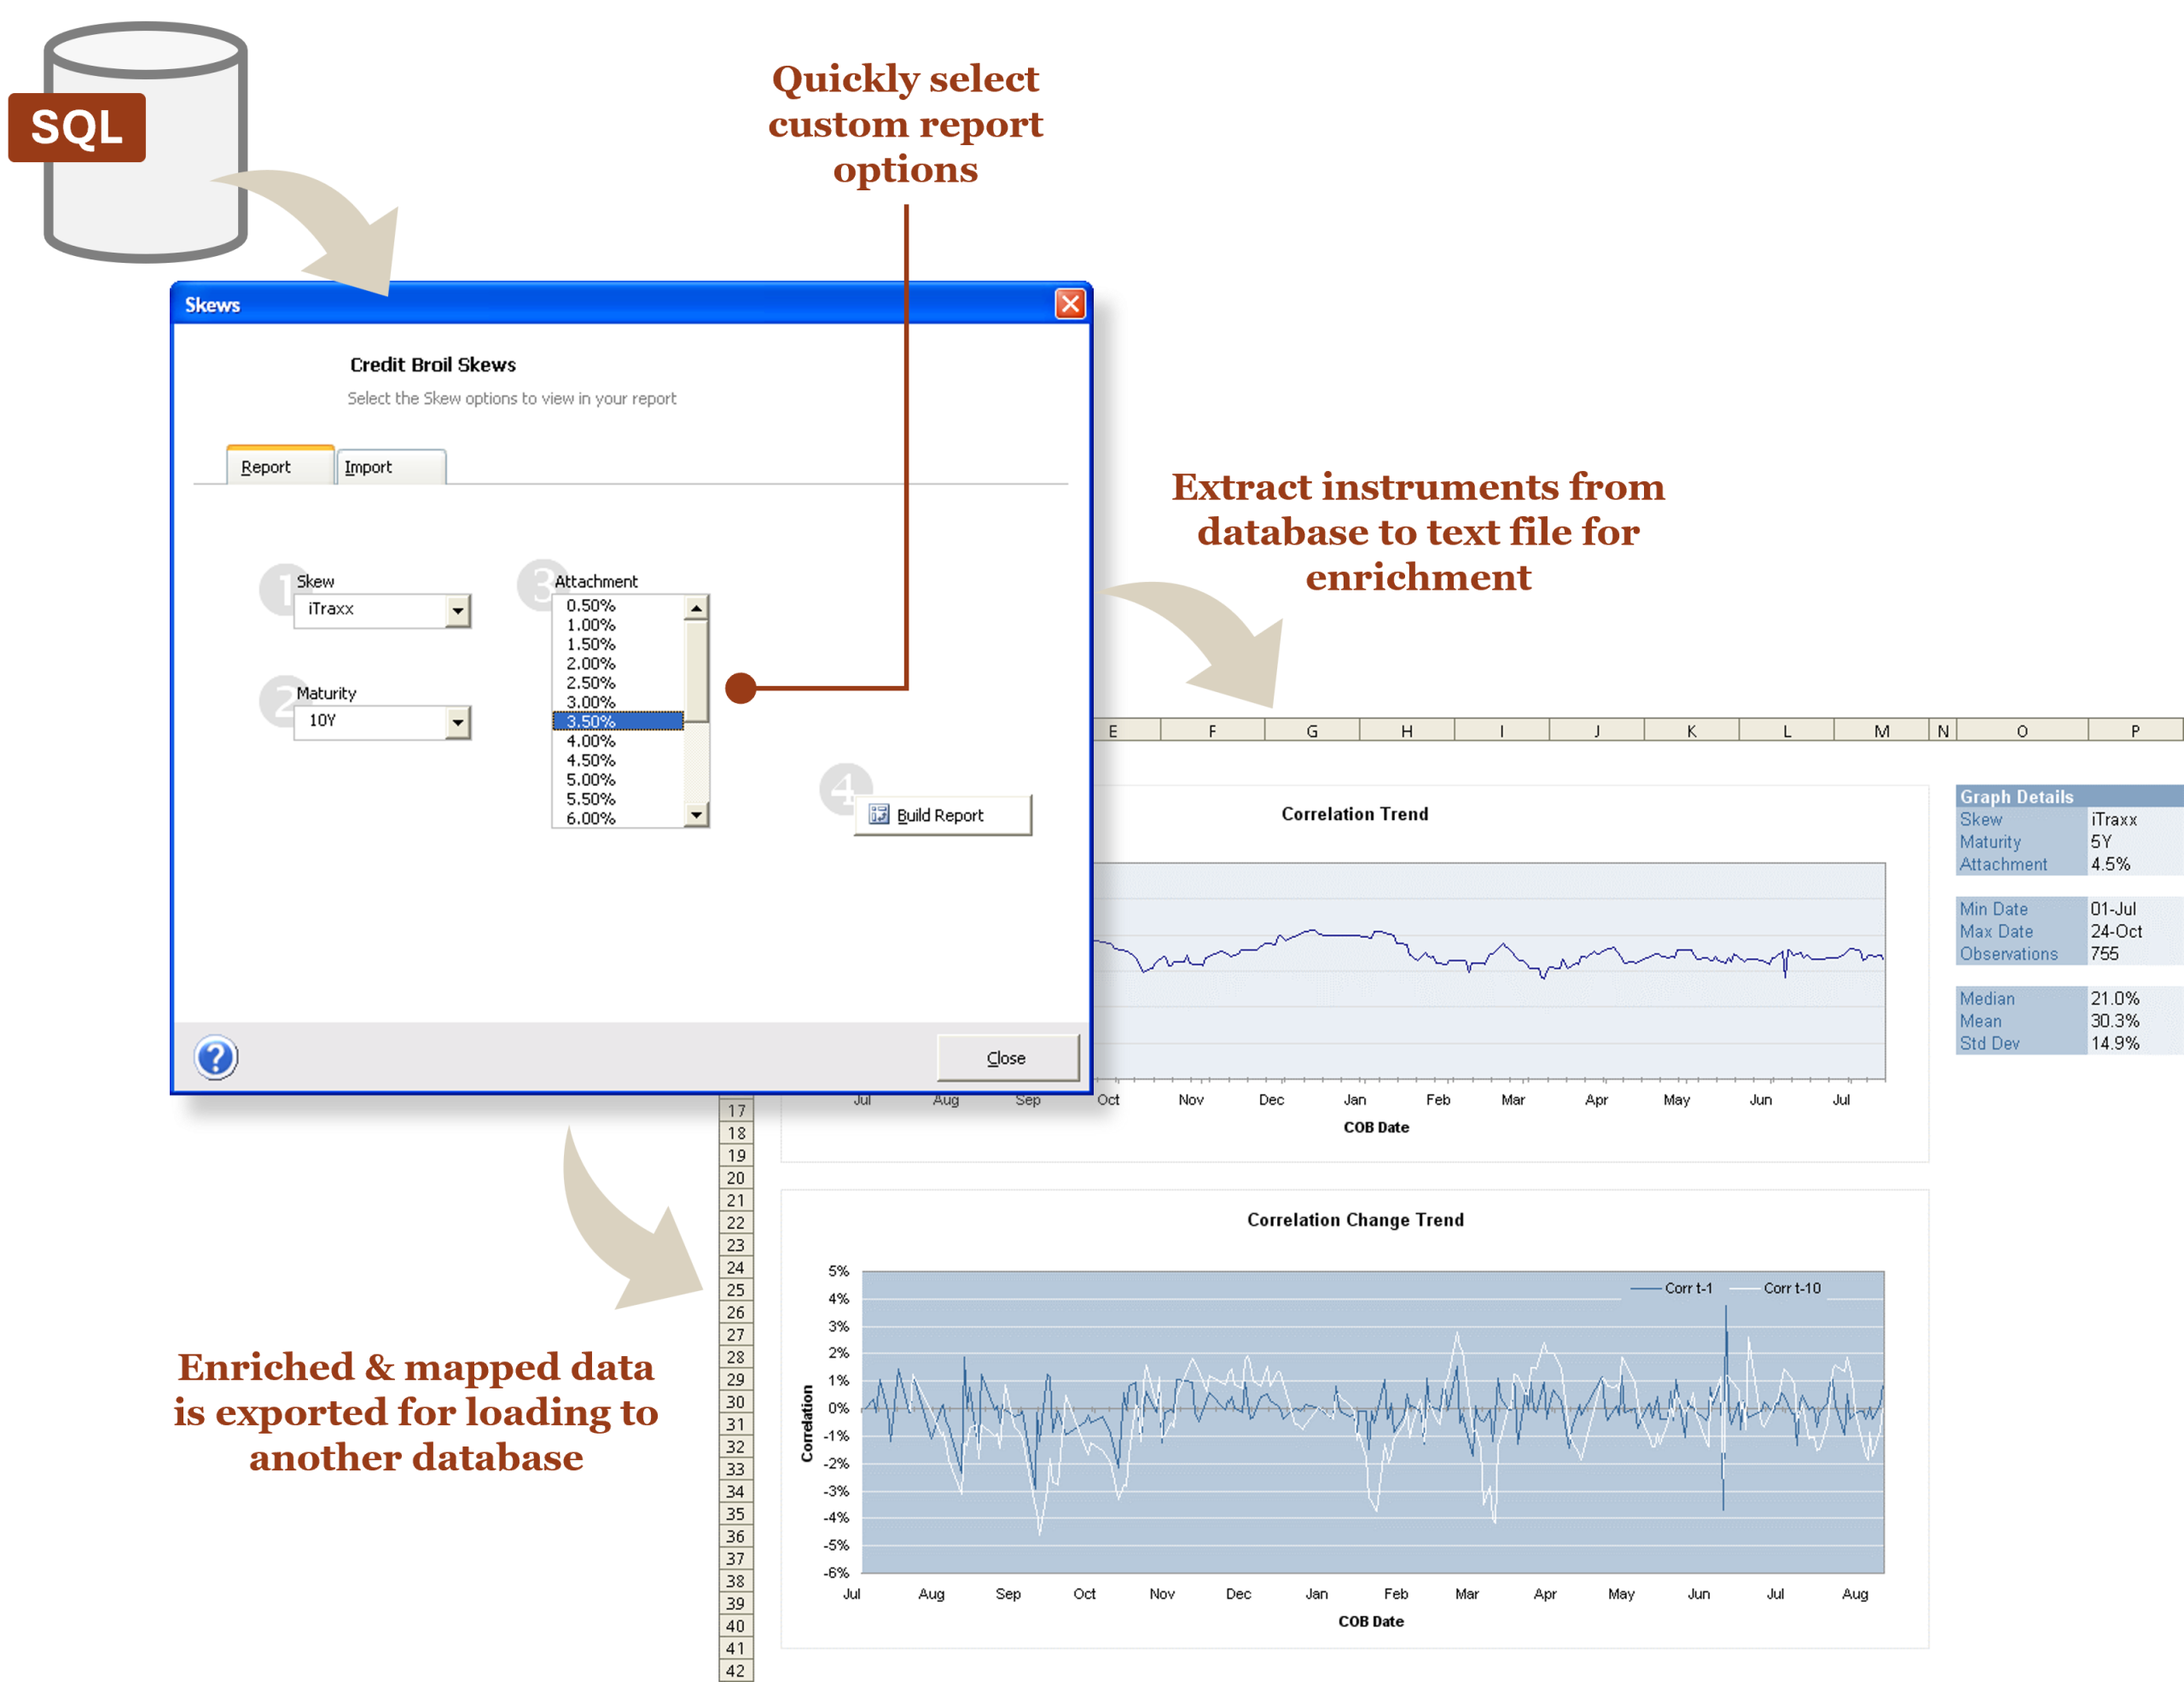
The bank’s analysts were manually retrieving index data from a corporate database to run correlation analysis across major fixed income indices.
Each report required manual extraction, data cleaning, and spreadsheet setup. This repetitive process slowed down the team’s ability to run timely analyses, respond to portfolio managers, and support investment strategy decisions—especially when rapid shifts in market volatility required on-demand correlation views.
Solution Delivered
We built a custom Excel Add-In that connects securely to the firm’s internal market data source and automates the entire index correlation analysis process.
Key features included:
The Add-In enabled fast, repeatable, and analyst-driven insight generation, removing the bottleneck of manual data prep.
Results
Technology
Excel | VBA


Free Download
Explore 30 Excel Solutions Used by Leading Financial Services Firms
Discover how Excel automation can drive measurable results. This exclusive portfolio showcases over 30 high-impact projects, each designed to streamline workflows, save time, and reduce operational risks for financial services firms. Download now to see real examples of how we’ve helped firms like yours achieve ROI gains of up to 631%.


Ready to stop managing Excel and start improving it?
Book a 30-minute discovery call.
We'll look at your current Excel environment, identify where the biggest risks and inefficiencies are, and tell you honestly whether Excel on Tap is the right fit.
No sales pitch. No obligation. Just a straightforward conversation about your situation.